State · 1925 – 1979
Pahlavi dynasty
A state of 1925 – 1979 — 54 years in the Middle East and North Africa. It replaced Qajar dynasty. It was replaced by Iran. The atlas records 48 things within it — wars and battles 3 · unrest and atrocity 3 · natural disasters 2 · treaties 1 · people 39. Its line of rulers holds 2 people.
For the full story, the article on Wikipedia (CC BY-SA 4.0); this page holds what the record says of the state.
- Stood
- 54 years
- 1925 – 1979
- Rulers
- 2
- the shah
- Most ground
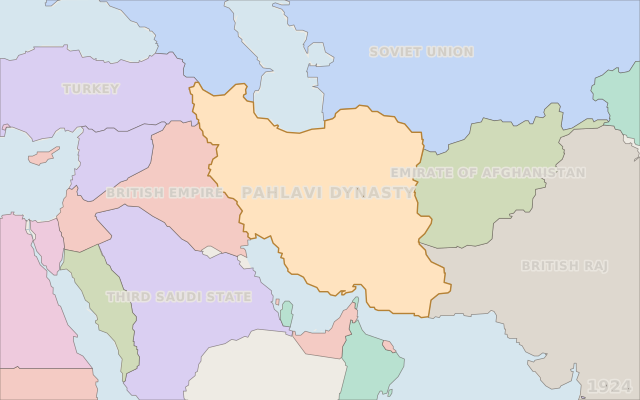
- 1.63 million km²
- in 1924
- Within it
- 48
- recorded rows
- Symbol
- 1
- on record, with years
Where it sits in time
Five thousand years, 3000 BCE to 2026; the state in gold, what it replaced or followed and what replaced or followed it in grey.
Before and after
The states the record files it as replacing or following, and those that replaced or followed it - Wikidata's own statements, each read from this state's side.
Before it
- Qajar dynasty · replaces · 1785 – 1925
After it
- Iran · replaced by · 1979 – present
Rulers
The line of shah.
| Ruler | Reign | Length | How it ended · source | To the ruler before |
|---|---|---|---|---|
| Reza Shah | 1925 – 1941 | 16 years | left office aliveread off the dates alone | |
| Mohammad Reza Pahlavi | 1941 – 1979 | 38 years | left office aliveread off the dates alone | child |
2 rulers, 2 with terms dated as terms, covering 1925 – 1979. Median reign 27 years. 0 of 1 handovers irregular - a killing, a deposition, a rival claimant, a rising or a coup beside it. A blank in the last column means no kin on record, which is coverage, never “unrelated”.
Ground held, by year
km² inside its borders as the borders dataset draws them, measured on an equal-area grid; a step series, held between the years the dataset maps.
1.63 million km² in 1925, 1.63 million km² in 1975; at its largest 1.63 million km² in 1925. Cliopatria, CC BY 4.0.
Flag or arms
Each symbol with the years its own statement gives; the timeline flies the one of the year on screen.
.svg/120px-State_flag_of_Iran_(1964%E2%80%931980).svg.png)
flag, undatedState flag of Iran (1964–1980) · Public domain
What happened within it, by century
Every row the atlas hosts under this state, by the century it began in: wars and battles in red, risings, regime changes and massacres beside them, everything else in grey. A tall bar is a century the record is full for, which is partly a fact about Wikipedia.
1900 – 199948 rows · 3 wars and battles · 3 risings, regime changes and massacres
- Shirin Ebadi · politician · 1947 – present
- Iranian Revolution · unrest · 1978 – 1979
- Jafar Panahi · artist · 1960 – present
- Ali Shariati · writer · 1933 – 1977
- Nasrin Sotoudeh · politician · 1963 – present
- Mir-Hossein Mousavi · artist · 1941 – present
- Ali al-Sistani · politician · 1930 – present
- Abbas Araghchi · politician · 1962 – present
and 40 more in the atlas.
Among all states
Each measure against the states that carry it, never against all of them: a bar is the share of those states below this one.
- How long it stood54 years
stood longer than 35% of 3,187 states with a recorded end or still standing.
- The most ground it held1,625,300 km²
held more ground at its peak than 89% of 1,465 states with a border in Cliopatria.
- Wars recorded per century2.0
had more wars on record per century than 97% of 3,187 states, counting the wars the atlas hosts under each.
- How long a reign lasted, at the median38 years
had longer reigns, at the median, than 90% of 967 states whose dated line can carry a median.
- Rulers on record2
has more rulers on record than 34% of 1,968 states with a line of rulers.
What led to it, and what came of it
The investigation's own picture: 2 causes the record names and 1 result, the strongest six of each at their own years, joined to the state by the kind of claim - a recorded statement solid, the article's sentence dashed, a theory dash-dot.
Open the investigation: every row with its evidence, the conditions at the time, the theories condition by condition, and the succession analysed.
Theories that apply to its ending
Of 3 theories of why states fall, 1 has every condition present at this ending; each is applied by its own logic, condition by condition, and whether its authors named this case is a footnote.
Demographic-structural breakdown
Goldstone 1991 · Turchin & Nefedov 2009
Applies by its own logic: 2 of its 3 conditions held here (it needs 2), and this is the kind of outcome it predicts — unrest, adverse regime change or the state's ending.
- famine, plague or disaster within 30 y in the state, or population up 25% over 50 y — prior
- a war the state is fighting, still under way, or a war the state fought, ended within 10 y — warEnded
Open in the atlas
- On the timeline, 1915 – 1989, with everything that stood beside it.
- On the map in 1924, live: scrub the year and watch its borders move.
- Investigate it: what led to it, what came of it, and its succession analysed.
Wikidata Q207991 (CC0) · borders Cliopatria, CC BY 4.0 · coast and rivers Natural Earth · symbols from Wikimedia Commons, each credited above · data built 2026-10-06 · Pastlas v2.9.1, by Oleh Voronko. The published atlas and its data are for non-commercial use.